Checklist JOAI 2026 Competition · Task 1
Lever Position from Mouse Brain Activity
Japanese title: JOAI Competition 2026
Predict, frame by frame, the position of a lever operated by a mouse from wide-field calcium-imaging signals of its brain.
The task
Mice perform an operant learning task: a tone (cue) is played at random times; a mouse that pulls a lever and holds it for a set time receives water as a reward. Over repeated trials the mouse is expected to learn that pulling the lever after the tone yields the reward. Brain activity was recorded during the experiment by wide-field Ca²⁺ imaging, which observes activity across the surface of the cerebral cortex at low spatial resolution. The competition data were built from Kondo et al., 'Multimodal dataset linking wide-field calcium imaging to behavior changes in operant lever-pull task in mice', Scientific Data 12, 1264 (2025); contestants may read the paper, but use of that dataset is prohibited.
Using the Allen Mouse Brain Common Coordinate Framework, the cortex is divided into 22 anatomical regions in each hemisphere, and the mean activity time series of each region is provided. Several mice each took part in 14 days of experiments, and multiple short sequences were cut out of each day's recording. A sequence is identified by sample_id and consists of 20–40 consecutive rows (frames). Besides the brain signals, experimental information (mouse ID, experiment day, timestamp) is given; event information such as reward or tone timings is not included.
The task is to estimate the lever position (column lever) at every time step of each test sequence. The target is present only in the training data. The organisers stress that the target is the state of the lever, not the movement of the mouse itself.
Abridged and translated by SOTA from the official Japanese materials. The official statement has the exact rules, and it wins wherever this summary differs.
In English
This task was published in Japanese. SOTA translated its 3 files into English on 17 September 2026.
- Competition overview Japanese original of Competition overview
- Data description Japanese original of Data description
- Official commentary (slides) Japanese original of Official commentary (slides)
Read the competition overview in English
Lever Position from Mouse Brain Activity
English translation by SOTA – AI Community of the Japanese original, shared under CC BY-NC-SA 3.0 IGO like the original. Organisers who would like this translation removed can email [email protected].
Competition overview of the Kaggle competition "[Playground]JOAI Competition 2026": "A competition page equivalent to JOAI Competition 2026".
What is JOAI2026?
The Japan Olympiad in Artificial Intelligence (JOAI) was held from 5 to 15 February 2026 and also served as the selection of Japan's national team for the International Olympiad in Artificial Intelligence (IOAI), one of the international science olympiads. This competition makes content equivalent to JOAI2026 available for practice.
Summary
In this competition, you will build a prediction model that estimates, from a mouse's brain activity data, how far the mouse is pulling a lever (the lever position). The brain activity was measured with a technique called wide-field calcium imaging and is provided as multiple time-series signals, one for each brain region. Using the brain activity information at each time point, predict the lever position at the same time point, as a time series.
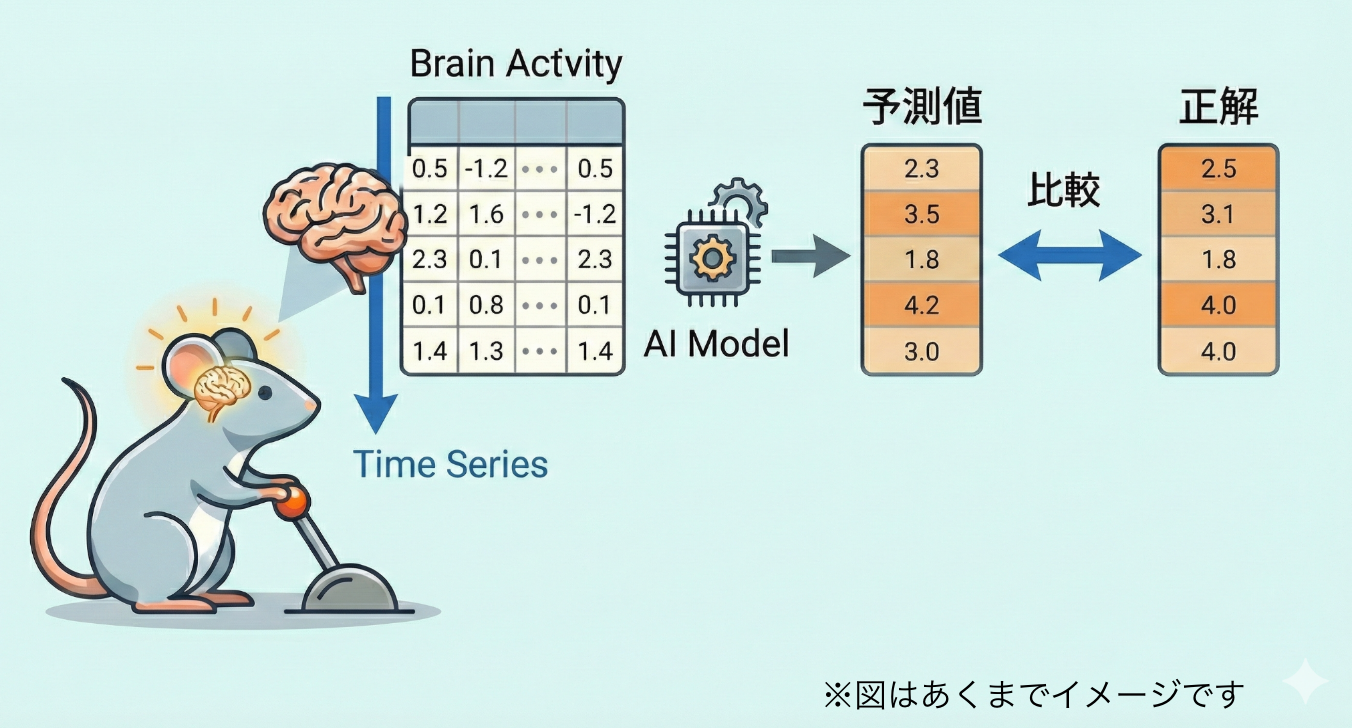
Figure labels (translated): brain activity (time series) → AI model → predicted values, compared with the ground truth. "The figure is for illustration only."
Description
Data for this competition
In this competition, you will build a model that estimates the position (state) of the lever at each time point from the mouse's brain activity. Predictions are made for every time step of the time series.
The information available is mainly of the following three kinds.
- Experimental information (e.g. mouse ID, experiment day, time information)
- Brain activity information (time-series signals obtained by wide-field calcium imaging; explained below)
- Lever state (target)
Because the lever state (target) is the quantity to be predicted, it is included only in the train data and is not included in the test data.
For details such as the data format, the meaning of the columns and the granularity of the time series provided, see the Data tab.
The mouse experiment
The mice perform the following learning task (behavioural experiment).
A sound (cue) is played → the mouse pulls the lever and holds it for a set time → a reward (water) is given
The sound is presented at random times, after which the mouse may or may not pull the lever.
The experiment is designed so that, as the trials accumulate, the mouse is expected to learn the relationship "if I pull the lever when the sound plays, I get a reward".
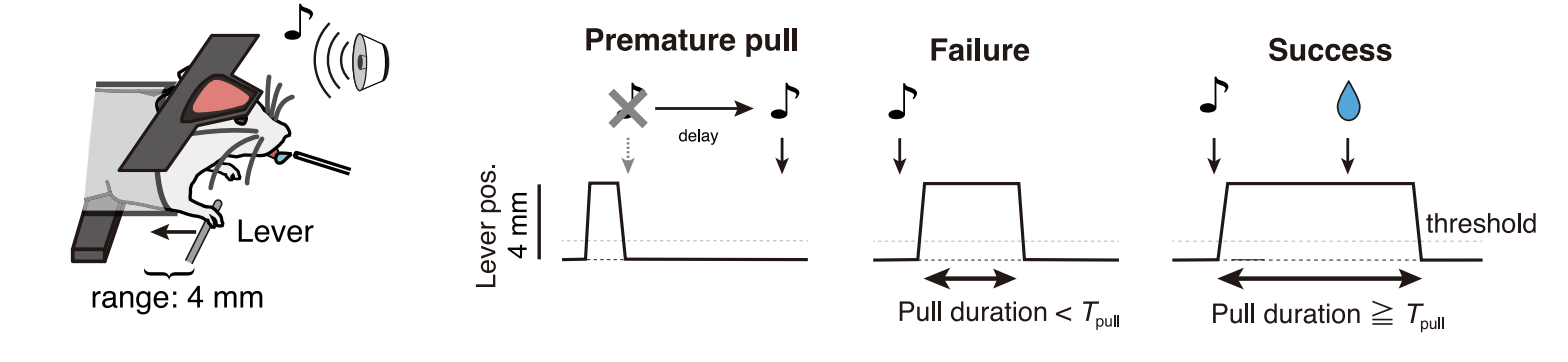
Note: detailed event information from the experiment, such as the timing of the "reward" and the "sound", is not included in this data (the data have been arranged in the form needed so that the analysis concentrates on the prediction task).
Brain activity (wide-field Ca²⁺ imaging)
The brain activity data provided in this competition are based on signals measured with a technique called wide-field calcium imaging (wide-field Ca²⁺ imaging).
When a nerve cell (neuron) is stimulated, it produces a small electrical signal, which travels to the far end of the cell. When the signal reaches the terminal, a switch is turned on that passes the information on to the next cell. One of the key substances in this process is Ca²⁺ (calcium ions). When a neuron is active, Ca²⁺ temporarily flows into the cell, and this rise in Ca²⁺ triggers the neuron to send a message to the next cell.
Calcium imaging uses a mechanism by which cells light up when Ca²⁺ increases: by observing the changes in Ca²⁺ that result from neural activity, it observes the activity of neurons indirectly.
Wide-field calcium imaging records activity over a wide area covering the whole surface of the brain (the cerebral neocortex). Because it observes such a wide area, its resolution is low; it is used to analyse activity patterns across regions rather than the activity of single cells.
For this wide-field calcium imaging, the Data tab explains how it was measured and preprocessed in this dataset and the form in which it is provided (sensor values per region, etc.).
Source data of the competition
This competition was created from the data of the following paper.
Kondo, M., Sehara, K., Harukuni, R. et al. Multimodal dataset linking wide‐field calcium imaging to behavior changes in operant lever‐pull task in mice. Sci Data 12, 1264 (2025). https://doi.org/10.1038/s41597-025-05482-y
You may read the paper to understand the dataset in detail, but please note that using that dataset is prohibited.
Evaluation
The predictions of the state of "lever" are evaluated with the MSE (Mean Squared Error).
The MSE is one of the metrics that express "how far off" the predictions are.
It is the mean of the squared differences between the predictions and the correct values.
In Japanese it is called "heikin nijō gosa" (平均二乗誤差, mean squared error).
The MSE has the following properties:
- the smaller, the better (the closer to 0, the more accurate the predictions)
- it penalises "predictions that are far off" heavily
When there are data points, with the correct value and the prediction , the formula is:
- : the correct value (the true value)
- : the predicted value
- : the error (deviation)
Squaring this and taking the mean gives the MSE.
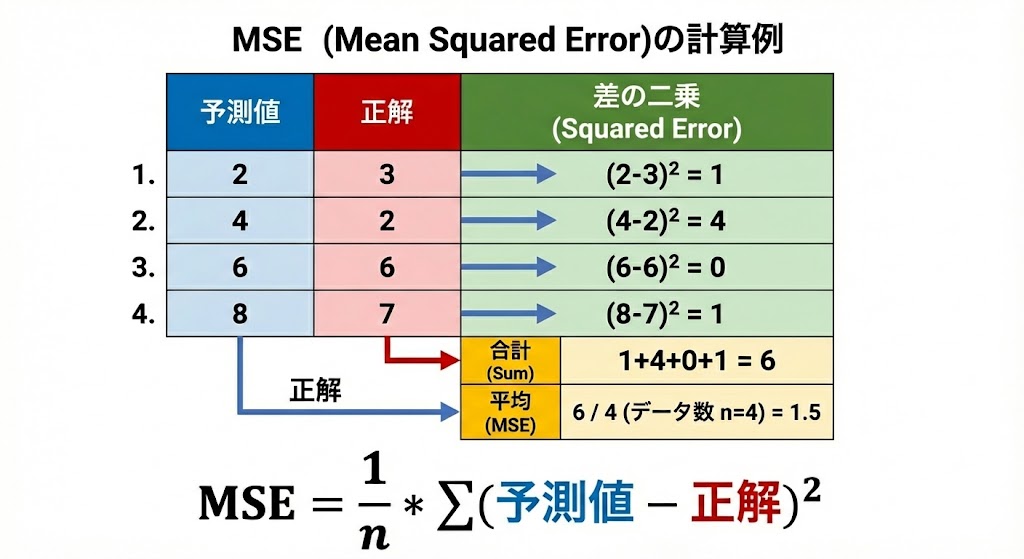
Figure (translated): worked example of the MSE (Mean Squared Error).
| Prediction | Correct value | Squared difference (squared error) | |
|---|---|---|---|
| 1. | 2 | 3 | |
| 2. | 4 | 2 | |
| 3. | 6 | 6 | |
| 4. | 8 | 7 |
Sum: . Mean (MSE): (number of data points ) . .
Timeline
- 27 February 2027, 18:00 – End
All times are Japan Standard Time (JST) unless otherwise stated. The organisers reserve the right to update the competition schedule if they consider it necessary.
Submission File
For each index in the evaluation set, you must predict the state of the lever. Create the file in the following format, including the header.
id, lever
mouse_78_day_4_002_0, 0.0
mouse_78_day_4_002_1, 0.0
mouse_78_day_4_002_2, 0.0
mouse_78_day_4_002_3, 0.0

etc.
For a detailed description of the columns, see the Data tab.
Special Thanks
In planning and designing this competition, we received a wide range of valuable advice and support from Kaggle Competitions Grandmaster tk (https://www.kaggle.com/tanakar) and fellow Grandmaster Junkoda (https://www.kaggle.com/junkoda), drawing on the deep expertise and extensive experience they have gained through competitions. We record this here with our sincere gratitude.
Translated by SOTA. The Japanese original is the official version and wins wherever the two differ. Translated from the organisers' public practice copy of the JOAI 2026 competition on Kaggle. The competition rules license the data under CC BY-NC-SA 3.0 IGO. Text inside the figures stays in Japanese; the translation describes it in words. This translation is shared under CC BY-NC-SA 3.0 IGO, the licence of the original. If you organise this olympiad and would like the translation removed, email [email protected] and we will take it down.
At a glance
- You get
train.csv: one row per frame with id,sample_id,mouse_id,day_n, time, lever (target) and the regional brain-activity columns AUDp_l, AUDs_l, …, VISrl_r (44 signals, 22 regions per hemisphere, according to the official review slides);test.csv: the same columns without lever;sample_submission.csvwith lever set to 0.0.- You submit
- CSV with header id,lever and one predicted lever position per test row (ids such as
mouse_78_day_4_002_0). - Scoring
- Mean squared error (MSE) between predicted and true lever values; lower is better. Kaggle setting: the public leaderboard uses 50% of the test data.
- Rules
- Individual participation only (team size 1).
- Python only.
- External datasets not provided by the competition are prohibited.
- Direct use of publicly available pre-trained models for training, inference or feature generation is prohibited; using them for exploratory analysis or idea generation is permitted.
- Generative AI tools such as ChatGPT, Cursor and Claude Code are permitted.
- At most 5 submissions per day; up to 2 final submissions may be selected.
- Publishing information, code or insights about the competition during the contest, and sharing information between participants, are prohibited; questions are answered on Discord.
- Top-ranked participants must submit a solution write-up (free format, Japanese or English) and their source code.
- The problem statement is provided in Japanese only.
- Format
- JOAI 2026 (2nd Japan Olympiad in AI), competition stage: online Kaggle community competition, 5 Feb 2026 19:00 – 15 Feb 2026 19:00 JST, open to a selection track (IOAI team candidates) and an open track. Followed by solution write-ups from top-ranked participants and online interviews (about 30 minutes each, selection track only); about four team members are chosen.