# The Line Rotates
*English translation by SOTA – AI Community of the Russian original. Organisers who would like this translation removed can email sota.ai.community@gmail.com.*
All-Russian School Olympiad in Informatics 2025–2026, Regional Stage, Grades 9–11
“Artificial Intelligence” profile, Tour 1, 17 January 2026
Task E
**Points for the task:** 50
**Answer submission format:** entering the answer
**Number of attempts:** 10
**Submission that counts:** the last one
## Statement
Imagine that we have a rectangle coloured in two colours: part of its area is white and part is black. We need to classify the points inside the rectangle by colour.
We use a very simple classifier: we draw a line $L$ through the centre of the rectangle. Everything that lies on one side of this line is considered black, and everything on the other side is considered white.
Now let us see how well such a line can “guess” the labelling. For any chosen line $L$, one can compute the fraction of the area where the predicted colour coincides with the true one.
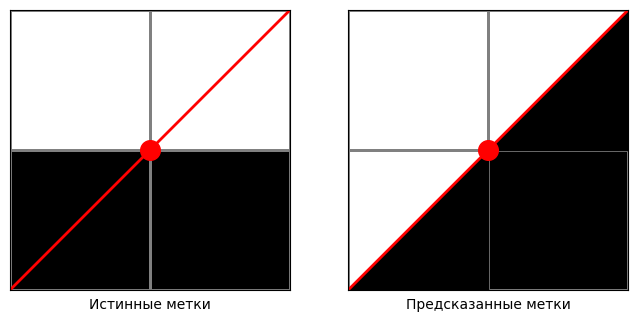
*Captions under the figure: left, “True labels”; right, “Predicted labels”.*
Consider the example of a $2 \times 2$ square. It is easy to see that the fraction of correctly predicted area is 0.75.
Among all lines $L$ passing through the centre of the rectangle, what is the largest value that the fraction of correctly predicted area can take? Compute the answers for each of the three pictures below.
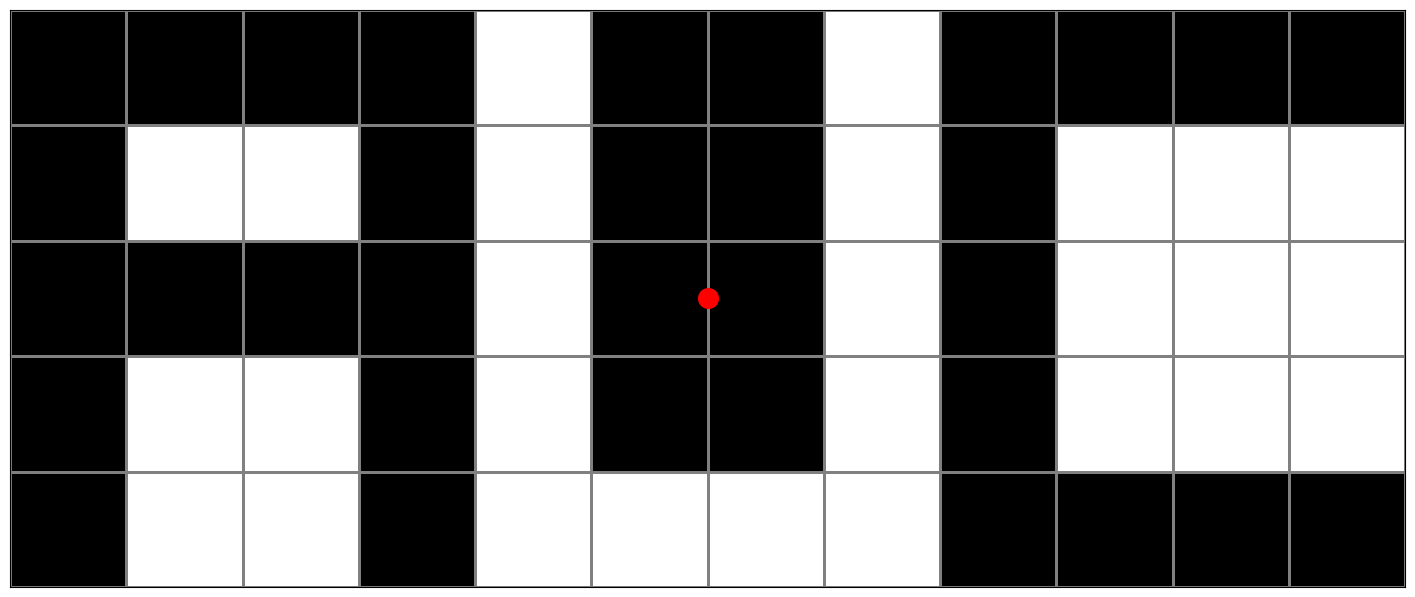
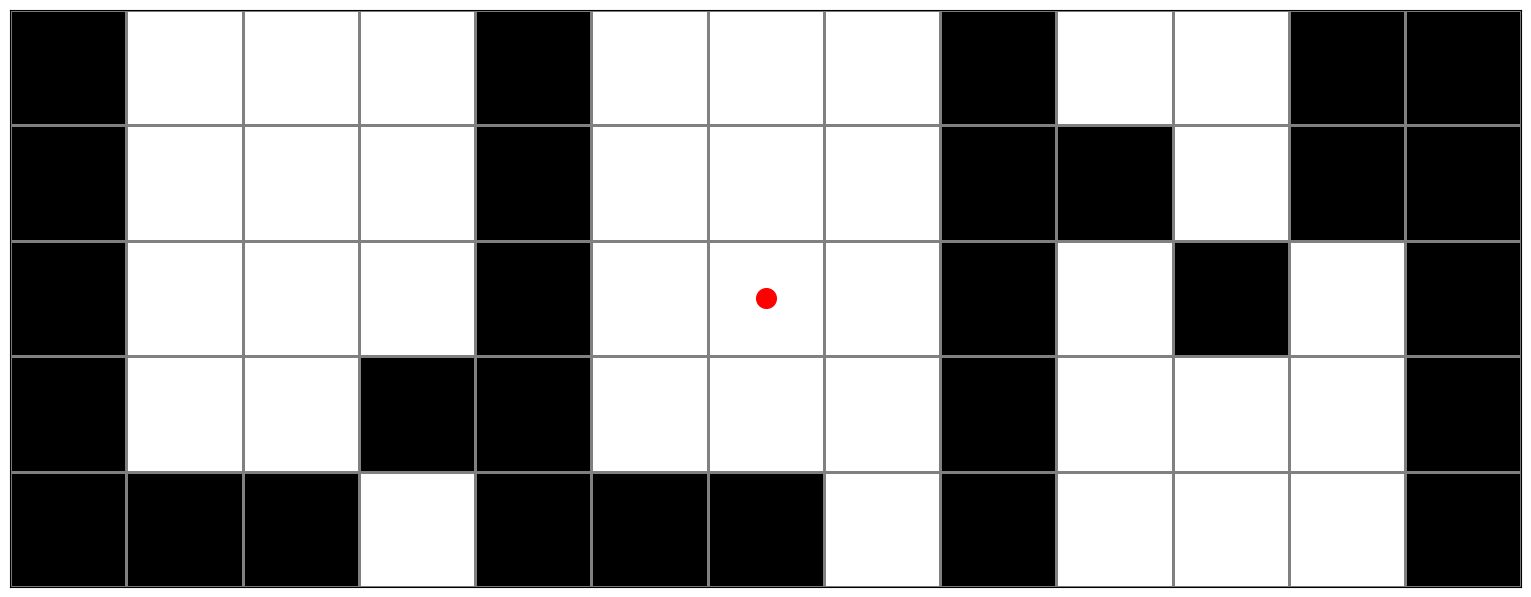
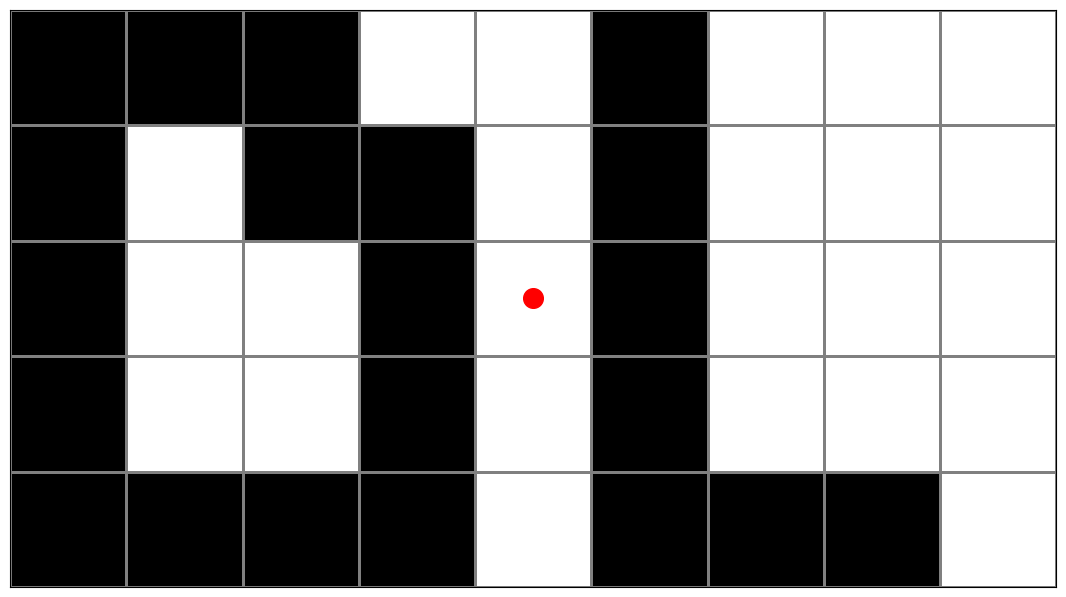
*Translator's note: the four figures above are the copies published with the official editorial; they are the same images as in the original statement. In each picture the red dot marks the centre of the rectangle. Cell by cell, the three pictures are as follows (`#` = black, `.` = white, top row first):*
Picture 1 (12 × 5):
```text
####.##.####
#..#.##.#...
####.##.#...
#..#.##.#...
#..#....####
```
Picture 2 (13 × 5):
```text
#...#...#..##
#...#...##.##
#...#...#.#.#
#..##...#...#
###.###.#...#
```
Picture 3 (9 × 5):
```text
###..#...
#.##.#...
#..#.#...
#..#.#...
####.###.
```
## Output format
Write the answers for the three pictures, separated by spaces. Round the answers to 6 decimal places, using a point as the decimal separator.
## Scoring
All three answers match: 50 points.
Two answers match: 25 points.
Test results are **not available** during the tour.