Checklist NEOAI 2026 Day 2 · Task 4
SOTA-AI Editorial
Day 2 Audio (Sped-up Speech Detection)
Detect which test speech clips have been sped up, using only a supplied Whisper checkpoint.
Hints
Hint 1
Observe the audio recordings.
Hint 2
What feature appears in some test recordings but not in the training recordings?
Hint 3
Are the training recordings clearer than the sped-up recordings?
The solution in one line
Measure temporal changes in the log-mel spectrogram to detect the blurred vertical edges characteristic of sped-up audio.
The editorial
Dataset Analysis
When several recordings from the training and test datasets are visualized as spectrograms, it can be observed that the test recordings have either blurred or sharp vertical edges, while all training recordings have sharp vertical edges. This suggests that the sped-up recordings have blurred vertical edges.
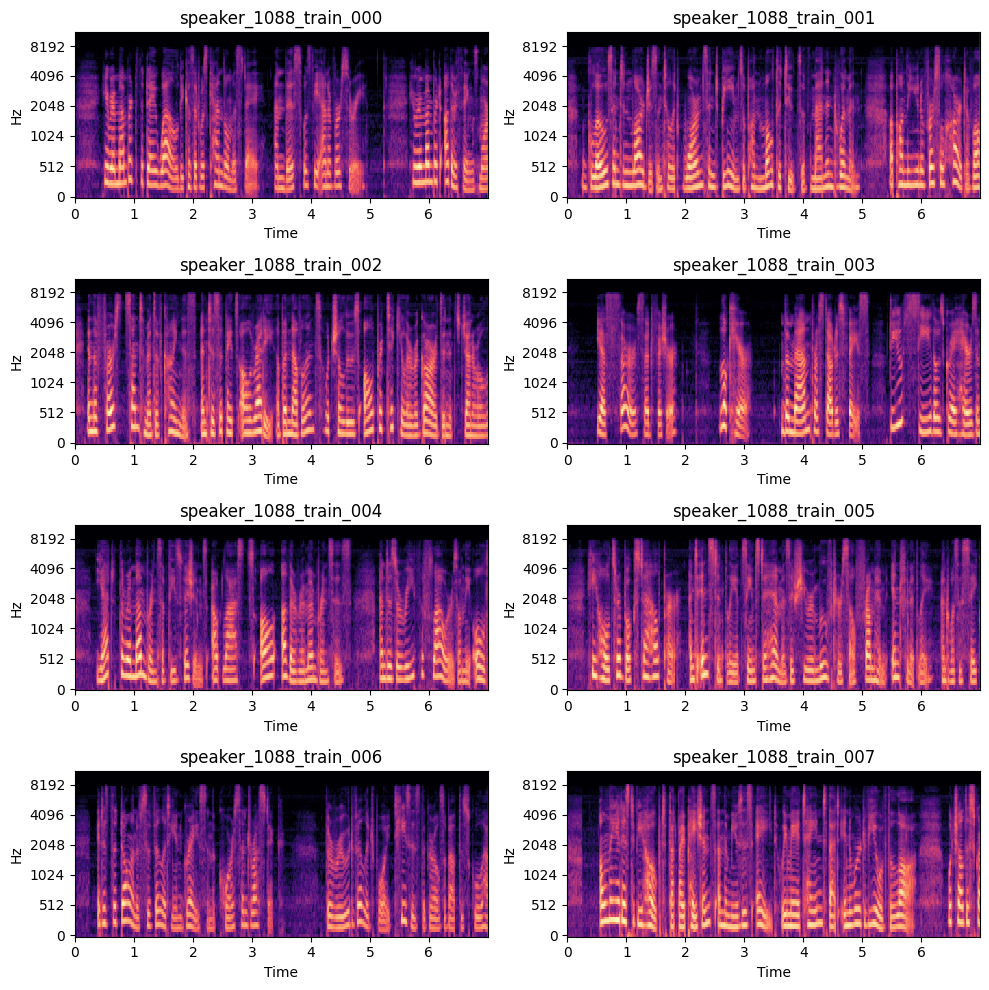
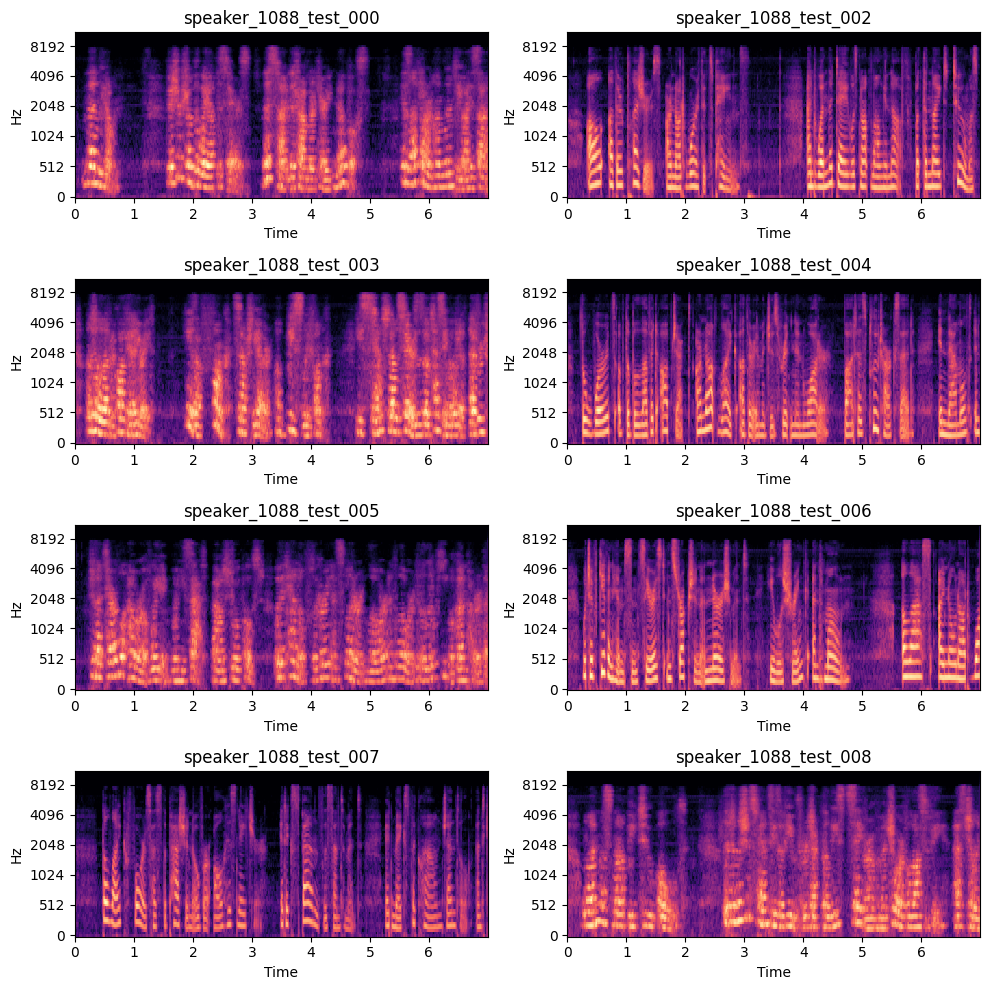
In the visualization, the test recordings with IDs 000, 003, 005, and 008 have blurred vertical edges, while the remaining recordings have sharp vertical edges.
Solution
Method 1
To detect vertical edges, we calculate the absolute difference between horizontally adjacent pixels in the spectrogram and then take the mean of all differences.
The submitted score is the negative of this mean, as the metric expects a higher score to indicate a higher probability that a recording is sped up.
Method 2
In the previous method, if two adjacent timesteps contain similar sounds but one has a higher frequency, the corresponding spectrogram may be shifted upward. This results in a large absolute difference between the two timesteps, which incorrectly indicates the presence of a vertical edge, even though there is no actual vertical edge.
To address this, we first calculate the sum of each timestep across all frequency bins. Then calculate the mean absolute difference between adjacent timesteps, as in the previous method.
Method 3
To further improve the solution, we can utilize the training data. First, we calculate the score from the previous method for every recording in the training dataset. For each speaker, calculate the mean and standard deviation of these scores.
For each recording in the test dataset, we calculate its score and then compute its z-score using the corresponding speaker's mean and standard deviation from the training data. This allows us to measure how much a recording's score deviates from the speaker's typical score.
Result
| Method | Public Score | Private Score |
|---|---|---|
| Baseline | 0.754 | 0.643 |
| First method | 0.988 | 0.997 |
| Second method | 0.991 | 0.997 |
| Third method | 0.999 | 0.995 |
Running Time
Calculating the scores for all recordings takes approximately 15 seconds on a CPU, which is well below the time limit.
Code
Solution code
import librosa
import numpy as np


def temporal_difference(audio_path, method=1):
    audio, sr = librosa.load(audio_path, sr=None)

    mel = librosa.feature.melspectrogram(
        y=audio, sr=sr, n_fft=1024, hop_length=256, n_mels=80
    )

    log_mel = librosa.power_to_db(mel, ref=np.max)

    if method == 1:
        d = np.abs(log_mel[:, :-1] - log_mel[:, 1:])
        return d.mean()

    tmp = log_mel.sum(0)
    d = np.abs(tmp[:-1] - tmp[1:])

    return d.mean()


def solution(train_df, test_df, method=1):
    train_df = train_df.copy()
    test_df = test_df.copy()

    test_df["mean_diff"] = [
        temporal_difference(path, method) for path in test_df["audio_path"]
    ]

    if method < 3:
        return -test_df["mean_diff"]

    train_df["mean_diff"] = [
        temporal_difference(path, method) for path in train_df["audio_path"]
    ]

    speaker_stats = (
        train_df.groupby("speaker_id")["mean_diff"]
        .agg(["mean", "std"])
        .rename(columns={"mean": "speaker_mean", "std": "speaker_std"})
    )

    test_df = test_df.join(speaker_stats, on="speaker_id")

    test_df["z_score"] = (test_df["mean_diff"] - test_df["speaker_mean"]) / (
        test_df["speaker_std"] + 1e-8
    )

return -test_df["z_score"]Editorials are written by members of the SOTA community, not by the olympiad. The official statement and scoring win wherever an editorial differs.